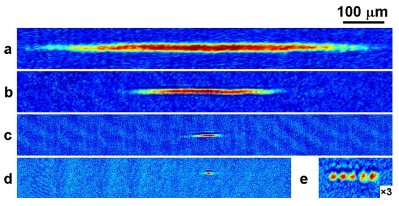
We are able to study a host of different phenomena by tuning the interactions between atoms. In the figure on the right, we show images of condensates at different scattering lengths, ranging from repulsive (a-c) to attractive (d,e). As the scattering length is reduced from 300$a_0$ in figure (a) to 0.1$a_0$ in figure (c), the effect of interactions are evident from the decrease in the size of the condensate. As we cross through the zero-crossing, the interactions change from being repulsive to attractive, where we can form single solitons (d) or soliton trains (e). One method of determining the scattering length relies on using the measured radius of the condensate in order to properly calibrate the magnetic field (which is what we actually change). An alternative method relies on modulation of the magnetic field, in order to form dimers. Near the Feshbach resonance, the relationship between the binding energy and the scattering length is quite simple ($E_b = \hbar^2 / m a^2$).
When the magnetic field is modulated at a frequency corresponding to the binding energy of the dimer, two atoms pair to form a dimer, and are subsequently lost from the trap when they collide with another atom. Although we don’t directly observe these dimers, we detect their loss by looking at the number of remaining atoms. In the figure above, we see the fraction of atoms remaining as the frequency the magnetic field is modulated is varied. Just shy of 450 kHz, we see a sudden loss in atoms as we sweep through the dimer’s binding energy.
In the figure to the right, we see binding energy (from which we determine the scattering length) for a range of magnetic fields. The red points correspond to measurements using condensates, and the black points correspond to data using a thermal gas. For lower scattering lengths, very far from the universal regime, we rely on the size of the condensate to calibrate our scattering length. This is particularly important for our soliton data.
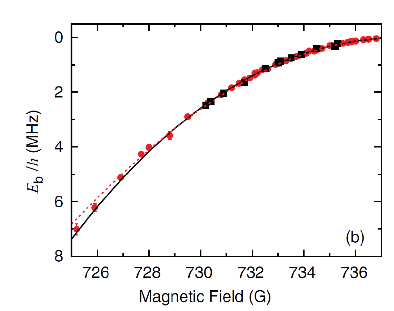
Figure 2: Results of modulation spectroscopy using condensates (red circles) and a 3 μK thermal cloud (black squares). The lines correspond to fits of the data to a universal model (black) and a model correcting for nonuniversal short-range effects (red) using the field-dependent effective range.
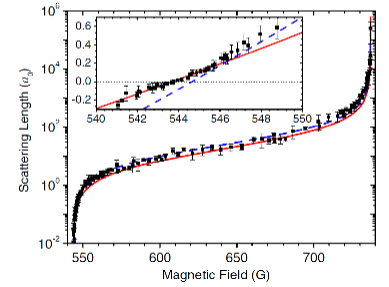
In the figure to the right, we show scattering length vs. magnetic field in this region. In particular, the region of interest for solitons is shown in the inset, where we can see that the zero-crossing has a small slope, giving us the ability to finely tune our scattering length in that range.